It is a big economic calendar with almost every report on housing released in a single week. This is the result of the shutdown delay. Now we can get more clarity on this important sector. Pundits will be asking:
Are lower mortgage rates helping home sales?
Last Week Recap
In last week’s installment of WTWA, I suggested that we watch the Fed for hints of a new course. That was an accurate prediction, since there is now a clear signal of a pause on interest rate hikes. More than that, the Fed seems to have recognized a problem with their model of low unemployment implying incipient inflation. Fed expert Tim Duy explains the significance of this change.
“It is hard to understate the importance of this shift. The Fed’s models haven’t worked this way in the past. In previous iterations of the forecasts, the expectation of unemployment remaining below its natural rate would trigger inflationary pressures. To stave off those pressures, the Fed perceived the need to raise rates above neutral to slow the economy enough to nudge unemployment upwards. Now the Fed believes it can let unemployment hold persistently below the natural rate without triggering inflation and without Fed policy becoming restrictive.”
This was the big news of the week, and it was bullish for stocks. I’ll comment on the negative reaction in my Final Thought.
The Story in One Chart
I always start my personal review of the week by looking at a great chart. This week I am featuring Jill Mislinski, who packs a lot of information into one chart.
Stocks dropped 0.7% on the week with a range of 1.7%. It seemed bigger because the decline all happened on Friday. You can see volatility comparisons in our Quant Corner.
Personal Note
I am still on vacation but wanted to provide an indicator update. I’ll try to do the same next weekend.
The News
Each week I break down events into good and bad. For our purposes, “good” has two components. The news must be market friendly and better than expectations. I avoid using my personal preferences in evaluating news – and you should, too!
News from the light calendar was not very significant. The big story was the yield curve inversion, leading to a big decline on Friday.
The Week Ahead
We would all like to know the direction of the market in advance. Good luck with that! Second best is planning what to look for and how to react.
The Calendar
The calendar is bigger than normal, especially considering that we are finally catching up on data from the shutdown. Housing reports will be in the spotlight with starts, permits, new homes and pending sales all reported. I don’t think we have ever seen all of them in a single week before. We also have personal income and spending, consumer confidence, and PCE prices (the favorite Fed measure of inflation).
And of course, continuing drama from Washington.
Briefing.com has a good U.S. economic calendar for the week. Here are the main U.S. releases.
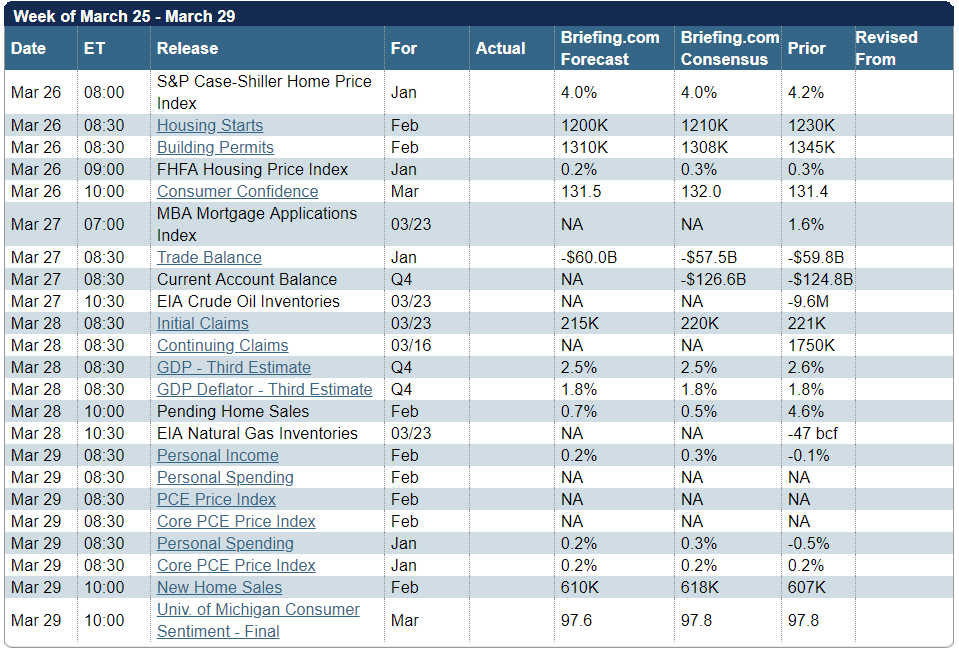
Quant Corner and Risk Analysis
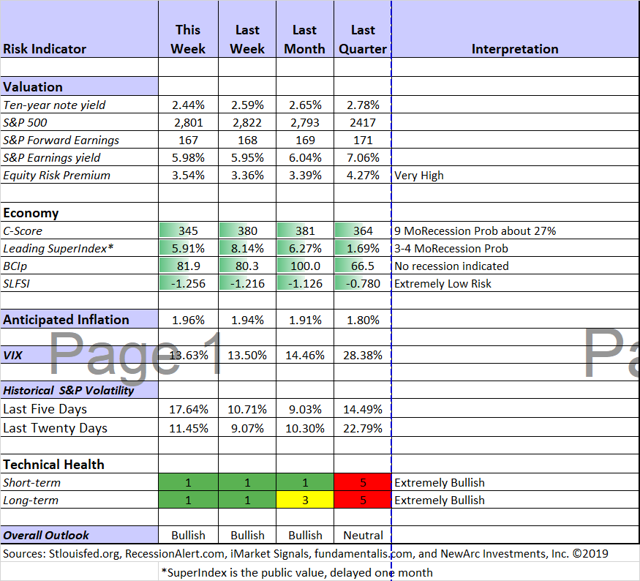
I have a rule for my investment clients. Think first about your risk. Only then should you consider possible rewards. I monitor many quantitative reports and highlight the best methods in this weekly update, featuring the Indicator Snapshot.
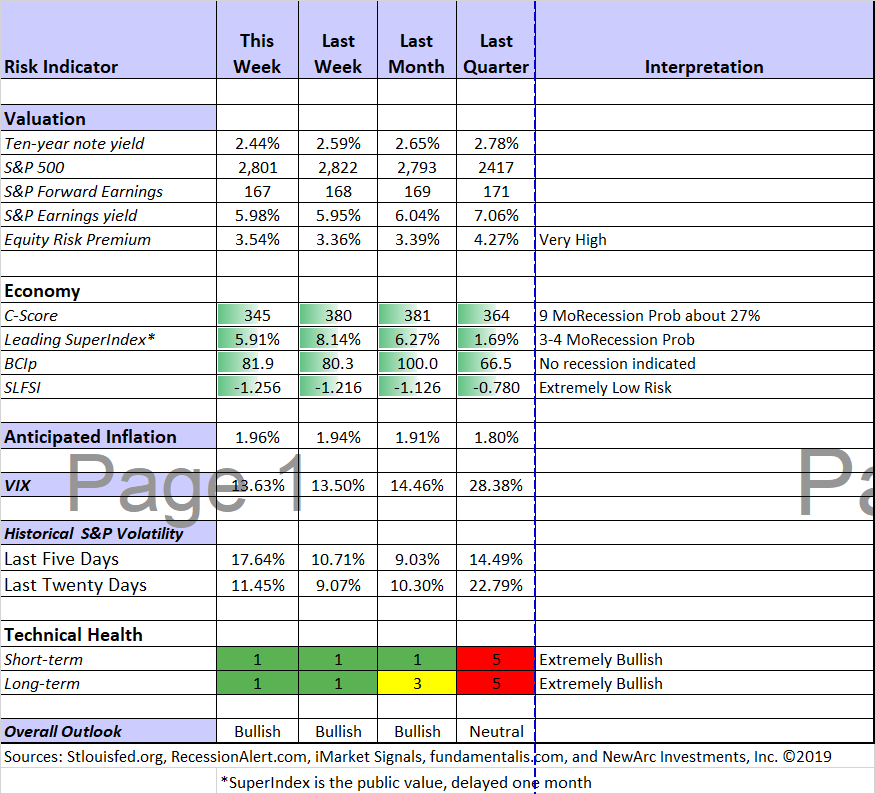
Short-term and long-term technical conditions continue at the most favorable level. Our fundamental indicators have remained bullish throughout the December decline and rebound. The C-Score declined – a situation I am watching closely, but not with alarm.
The Featured Sources:
Bob Dieli: Business cycle analysis via the “C Score.
Brian Gilmartin: All things earnings, for the overall market as well as many individual companies.
RecessionAlert: Strong quantitative indicators for both economic and market analysis.
Georg Vrba: Business cycle indicator and market timing tools.
Final Thought
The reaction to the Fed news was strange. Something that logically is bullish for stocks led to selling. Fixed income traders jumped on the news to buy two-year and five-year notes. This drove yields lower and “inverted” part of the yield curve. We saw the typical instant stock reaction, starting with algorithms and then spreading – finally reaching your local news.
Bob Dieli calls the change in the curve a “kink.” Even if we got a recession signal, it would be a probability calculation, not a certainty, and it would be at least nine months away. Historically, the period before a recession, what Bob calls the “Boom” phase, has been good for stocks. This clearly needs more discussion, but I have covered much of it in past posts.
Part of the market reaction was declining PMI data from Europe. I have never featured this indicator because it is completely unproven. I am amazed that traders treat all data as equal. More to come on that subject as well.
Disclosure: I/we have no positions in any stocks mentioned, and no plans to initiate any positions within the next 72 hours. I wrote this article myself, and it expresses my own opinions. I am not receiving compensation for it. I have no business relationship with any company whose stock is mentioned in this article.